The Reality of Reporting in Microsoft Purview
One of the common questions from clients after implementing Microsoft Purview is a simple one:
How do we prove this is working?
This usually comes up after an organization is using Purview for a while. Once sensitivity or retention labels are in place, DLP policies are running, and the environment is starting to stabilize, the focus shifts to value. People want to show progress to management, demonstrate risk reduction, and justify the investment.
The challenge is that pulling that story together is harder than expected. It’s not because the data doesn’t exist, but because it lives in different places, serves different purposes, and doesn’t naturally come together into something easy to present.
The underlying issue
Purview is not really designed to be a reporting platform in the way people expect.
It’s built to help you understand your data, apply controls, and manage risk in near real time. The reporting pieces follow that same design philosophy. They are useful for day-to-day visibility and operational awareness, but they aren’t trying to give you a long-term, structured view of your data estate.
What you end up with is a mix of perspectives:
snapshots of what your data looks like today
short-term trends showing what’s changing
detailed activity showing what users and policies are doing
Each of those is valuable in its own right, but none of them tells the full story on its own. When you try to answer broader questions around adoption, impact, or ROI, you start needing to stitch things together.
This article is the first in a series to describe the Purview reporting options. This first part focuses on what's available out of the box with Purview, and the second part will explore add-ons and DIY options.
What you get with Purview
The reporting capabilities in Purview fall into a few feature categories.
1. Current state view with Data Explorer
The Data Explorer (previously Content Explorer) is one of the most direct way of understanding what exists in the environment today. It gives you a point-in-time view of your data, including where sensitivity labels are applied, where sensitive information shows up, and how content is distributed across locations.
This is useful for grounding conversations. If someone asks how much content is labeled General, or where sensitive data is concentrated, you can usually answer that fairly quickly, at least at a high level.
Purview Data Explorer view of sensitivity labels usage across core workloads
In this screenshot, there are about 25 items across OneDrive, SharePoint and Teams labelled General.
There are a few practical limitations that tend to come up once you start relying on it more heavily.
First, it’s not always as straightforward to slice the data as people expect. You get a good overall view, but breaking things down cleanly by department, business unit, or even specific sites can take some effort depending on how your environment is structured.
Second, it’s still very much an administrative tool. It’s built for analysts and admins who are comfortable navigating the interface, not for producing something you can lift directly into a report or share with leadership. Also, leadership often wants to know about trends over time, for example how much is labelled this year vs. last year. It tells you what things look like now, but doesn’t keep track of how that picture got there.
There are also some quirks around scale. In larger environments, you may run into limits on what’s shown in the UI, which means exporting or drilling further becomes part of a manual workflow.
Finally, the numbers are not always accurate as they are approximate values. Even though it’s a “current snapshot,” it is not guaranteed to be perfect or complete at any moment, because the Content Explorer reflects what the Purview classification service has scanned to date. This means that new content or newly labeled content may not appear immediately.
So it’s useful, but it only as a current view or snapshot in time.
2. Short-term trends with Posture Reports
Posture reports and DSPM dashboards start to introduce a sense of movement. You can see shifts in label adoption, patterns in DLP activity, and changes in overall risk posture.
They are helpful, especially when you’re actively managing and tuning your environment. You can tell if things are trending in the right direction or if something has changed unexpectedly.
At the same time, they’re built around relatively short time horizons. Currently this is a 30 day rolling window rather than a long-term history. There are a few types of reports at the time of this writing:
Purview Posture Reports landing page
Here is what a report looks like. It’s a report of what users are doing with labels over the past 30 days:
Purview label distribution report
Posture reports are where things start to feel closer to what people are looking for. They pull together signals from across Information Protection and DLP and try to present them in a way that answers broader questions.
You’ll see things like:
how much content is labeled vs unlabeled
how labels are being distributed
where DLP activity is concentrated
how those patterns are changing over time
That makes them well suited for operational oversight of the recent past, but not as strong when you’re trying to show progress over quarters or years.
They’re designed to give you a sense of direction rather than precision. You’re not looking at exact counts so much as movement such as where things improving, leveling off, or heading in the wrong direction.
3. Activity details with the Activity Explorer
Through Activity Explorer, you can see exactly what is happening: labels being applied or changed, users interacting with data, policies being triggered.
The key constraint is that it also only goes back 30 days.
What makes Activity Explorer useful is the level of context it provides. You’re not just seeing that something changed, you can often see how and where it changed such as: whether a label was applied manually or automatically, which application was involved, and which user triggered the action.
Purview Activity Explorer example
That makes it particularly helpful when you’re trying to validate whether policies are working as intended, or when you’re troubleshooting unexpected behaviour.
Also note that you can change the columns visible and save sets of filters to get back to your favourite views faster.
But remember, Activity Explorer reports within a limited window of 30 days, and it’s focused on a specific set of activities. For a broader or more complete history, the next option is moving into audit logs.
Once you have that data, the next step is almost always exporting it. That’s where the audit log becomes more useful when you can start to group, summarize, and trend the data outside of the Purview interface.
The trade-off is that this takes time. Queries can be slow, especially over larger time ranges, and the results are very granular. Turning the audit results into something that you can put in front of leadership usually means additional work in Excel, exporting into a database (for example in Azure), or shaping it into a model in Power BI.
Building a proper “audit log pipeline” is beyond the scope of this article, but something you can learn more about here: Export, configure, and view audit log records.
Note that how far back you can search the audit log is based on your organization's license. The default with E3 licenses is 180 days, and you can configure policies with E5 or add-on licenses to go back up to 10 years.
A practical way to approach Purview reporting
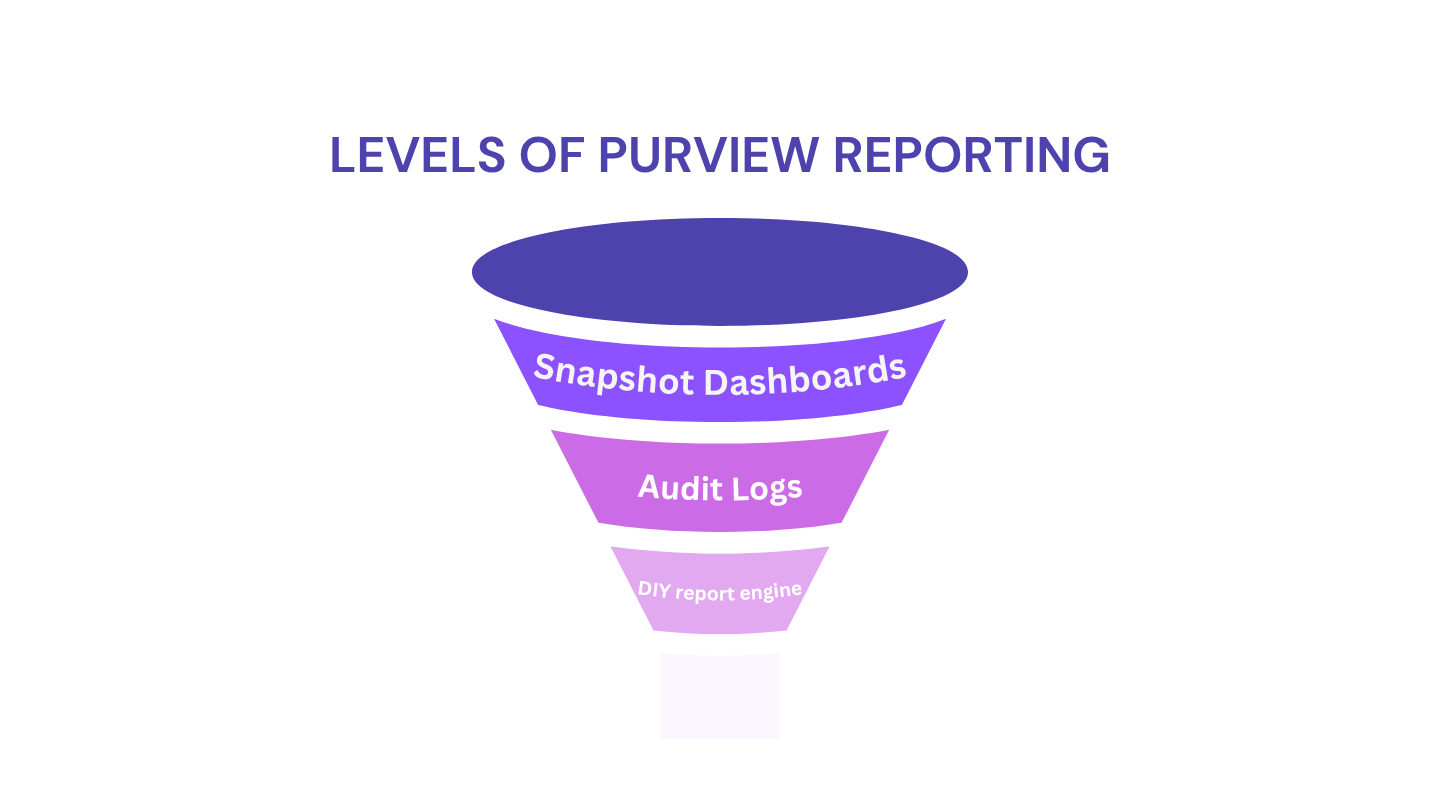
One approach I recommend is to think about Purview reporting in levels, based on how much effort you’re willing to invest.
Level 1: Stay within the core Purview product
At the most basic level, you can stay entirely within the product. Dashboards, explorers, posture reports, and some of the Microsoft 365 sensitivity governance reports give you a solid starting point. This is usually enough for operational use and quick checks.
Level 2: Get detail with audit log
If you need more detail, audit log searches and compliance activity data give you that depth, but they require more manual effort to extract and interpret. This tends to be more ad hoc, used for specific questions or investigations rather than ongoing reporting.
Level 3: DIY engine
Beyond that, organizations that want consistent, long-term visibility usually move toward building something of their own. That might start with PowerShell exports and evolve into a more structured process with stored data and Power BI on top. It’s more work upfront, but it’s the only way to get a reliable view over time.
Where this goes next
In the next part of this series, we’ll go deeper into the more advanced options.
That includes:
what you can realistically do with the out-of-the-box tools
how to work with audit and activity data without it becoming a bottleneck
what a repeatable reporting approach looks like
where more advanced or third-party options might fit
Purview gives you the signals you need to understand your environment. Turning that into something that clearly shows progress and value takes a bit more intention, and that’s where most of the real work ends up happening.